
Performance > Project Tracker
Overview Page
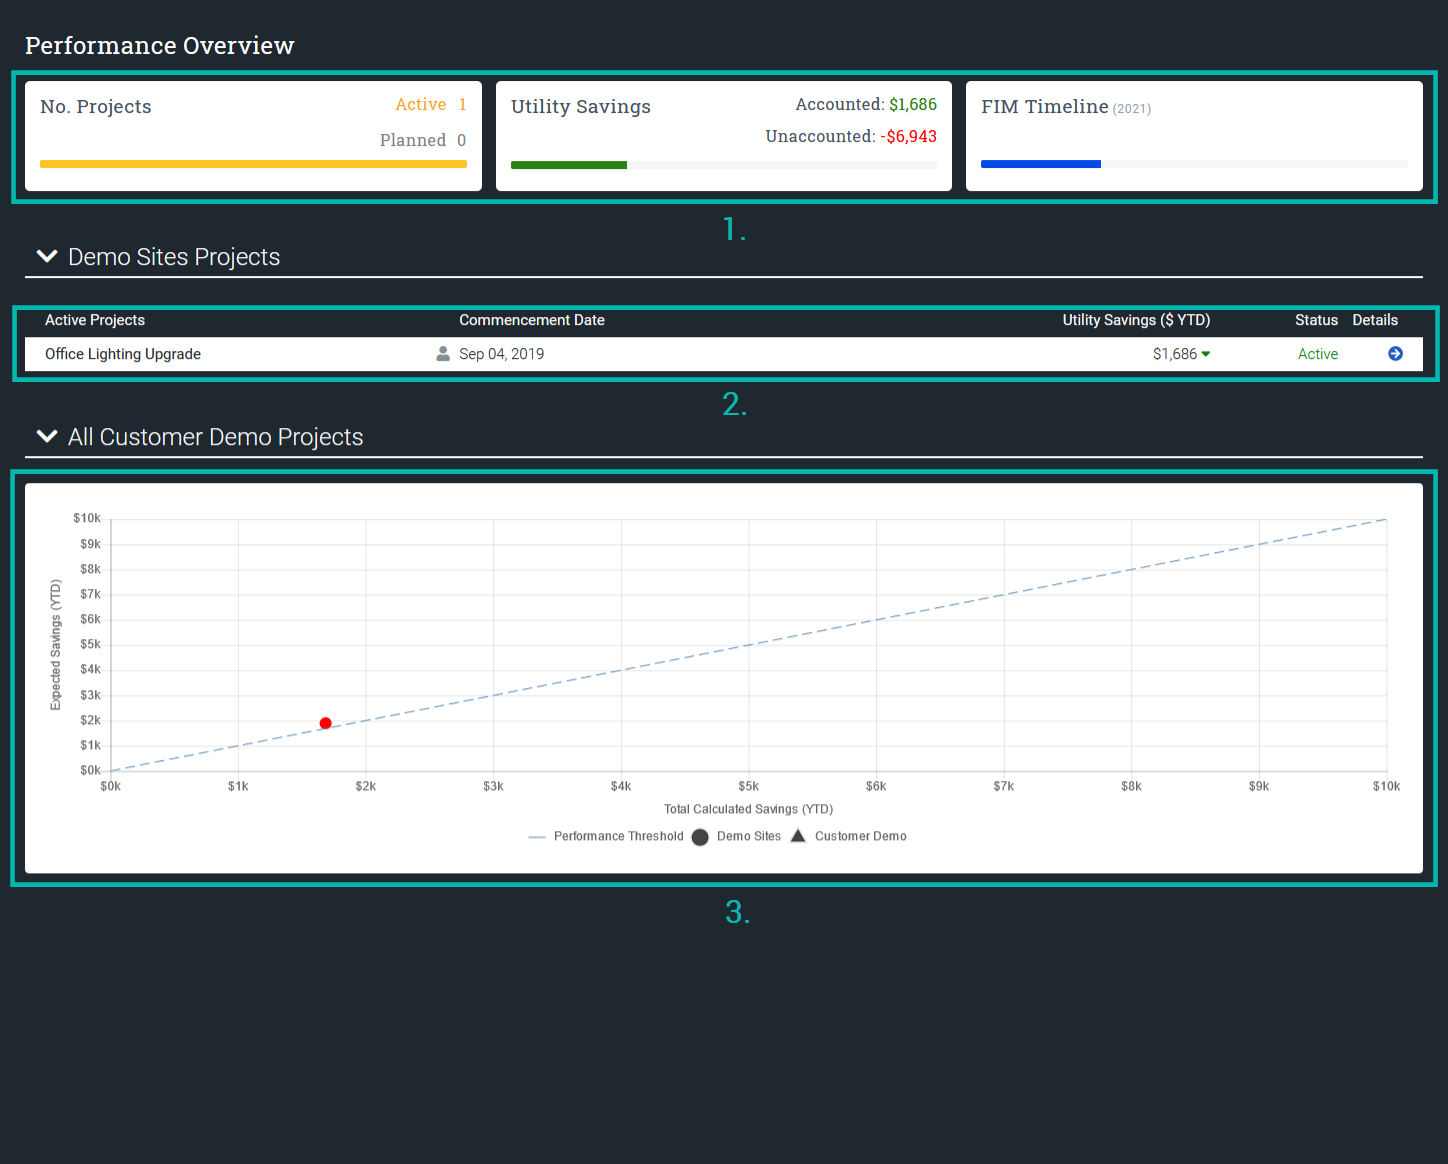
The overview page displays all the Projects that have been generated and run for the building or portfolio of buildings in the selected building group. There are a number of key elements on the page:
- A number of metrics shown provide an overview of all the Projects that are currently active and their impact on the building's ongoing expenditure. Accounted and unaccounted savings assist users with pinpointing savings that can be directly correlated to Projects and savings that are due to other factors.
- The list of all active Projects for the building/portfolio and the corresponding utility savings year-to-date. Click on the arrow button to open the individual Project where all the financial details can be viewed.
- A chart plotting the individual Projects in terms of expected savings against calculated savings. Projects that are "off-track" and performing below expectations are located on the top half of the line and highlighted in red.
Viewing a Project
- Click the arrow icon to view the Project summary page.

- The chart displays a comparison of the BAU (the original baseline model excluding the project related changes), Expected (the baseline model including all project related changes) and Actual (utility data from bills or BMS).
- The different metrics summarise the energy and financial savings of the different models.
- Click the Download button to obtain a summary report of the Project.

Comments
0 comments
Article is closed for comments.